Every breath we take shapes our health and well-being, and understanding the quality of the air we breathe is crucial in order to safeguard the health of all our systems: respiratory, circulatory, immune, etc. The American Lung Association (ALA) has served as a beacon of knowledge and advocacy in the ongoing battle for clean air, annually releasing its “State of the Air” report to provide valuable insights into the nation’s air quality for the past twenty-five years.
The freshly-released, twenty-fifth anniversary edition of the “State of the Air” 2024 Report offers a comprehensive analysis of air quality across the United States, drawing on data collected from thousands of monitoring stations nationwide.1 This year’s report sheds light on key trends, challenges, and improvements in air quality, providing policymakers, healthcare professionals, and the public with essential information to guide decision-making and action.
The lead takeaway: nearly 4 in 10 people in America live in places with unhealthy levels of air pollution. Read on to learn more.
Methodology
Before we delve into the findings, let’s take a moment to review how the American Lung Association’s “State of the Air” report is meticulously compiled.2 The data is sorted by ozone levels, short-term particle levels (using hourly averages to establish each daily maximum), and long-term particle levels (the yearly average).
The U.S. Environmental Protection Agency (EPA) is required to set health-based limits for six leading air pollutants: lead, carbon monoxide, nitrogen oxides, sulfur dioxide, particulate matter, and ozone. This is called the National Ambient Air Quality Standards. “State of the Air” looks at two of the most widespread and dangerous pollutants from this group, fine particulate matter (PM2.5) and ground-level ozone (O3).
In order to set the National Ambient Air Quality Standards, the EPA has created the Air Quality System (AQS), which includes thousands of monitoring federal, state, local, and tribal monitoring stations across the nation.3 The “State of the Air” report involves collecting data from the numerous AQS locations tracking ambient air pollution, as well as meteorological data.
Interestingly, the data is for the three-year period of 2020-2022, which was reviewed for quality and certified in 2023. Therefore, this year’s results might be a bit rosier than they will be next year since so COVID years are included in the data set, with everyone staying home there was significantly lower traffic.
The Good News
Despite major setbacks to improving air quality across the nation, the 2024 State of the Air report offers glimmers of hope and progress. It is indisputable that many regions have made significant strides in reducing air pollution levels and improving overall air quality through targeted interventions and policy measures like the Clean Air Act, which passed in 1970.
From stricter emissions standards for vehicles and industrial facilities to investments in clean energy and sustainable transportation infrastructure, proactive efforts have yielded tangible improvements in air quality and public health outcomes.
In fact, there are many cities in the US which have air that is considered clean for ozone or particulate matter. In the 2024 edition, 55 of the cities monitored had zero days with unhealthy short-term particle levels. Even better, a whopping 75 cities had zero days with high ozone levels.
The “cleanest cities” were not ranked, but listed in alphabetical order:
- Bangor, ME
- Johnson City-Kingsport-Bristol, TN-VA
- Lincoln-Beatrice, NE
- Urban Honolulu, HI
- Wilmington, NC
The Bad News
One of the standout findings of the 2024 report is the persistent threat of air pollution to public health, with millions of Americans living in areas with unhealthy levels of air pollution. Specifically, the report says the counties which got an “F” for particulate pollution or ozone in this year’s report have more than 131 million inhabitants, routinely breathing in unhealthy air.
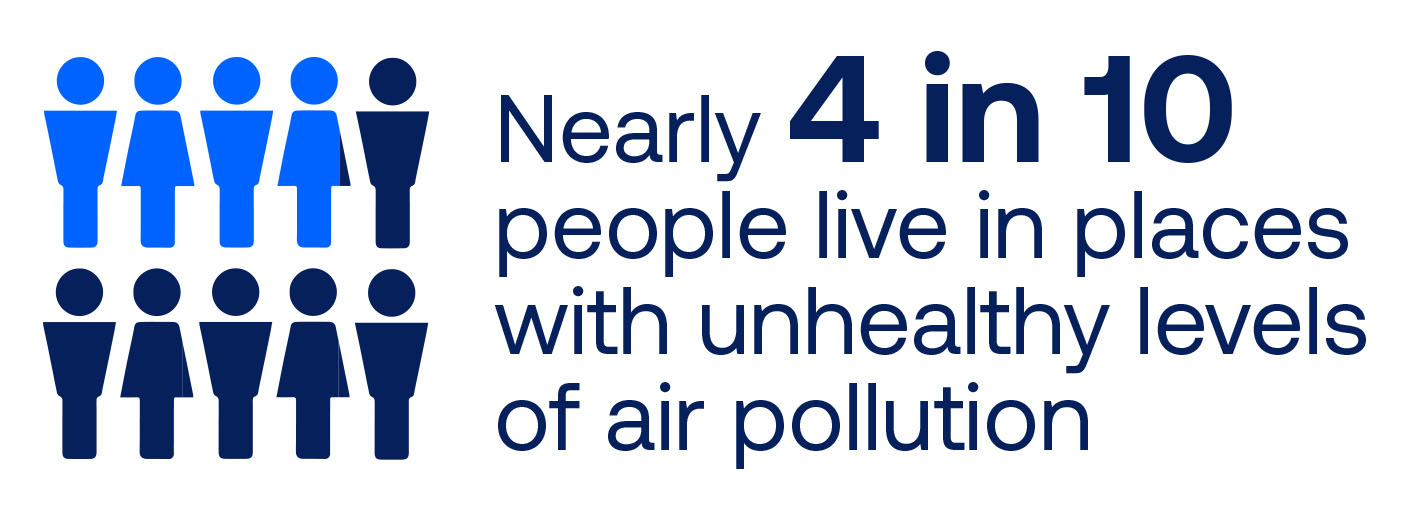
To put it another way, almost 4 out of 10 Americans live in places with unhealthy air pollution levels. Despite significant strides in air quality improvement over the years, many communities continue to grapple with elevated levels of pollutants like ozone, particulate matter, and other harmful airborne substances. These pollutants, emitted from various sources including transportation, industry, and wildfires, pose serious health risks, particularly to vulnerable populations such as children, the elderly, pregnant women, and individuals with preexisting respiratory conditions.
Another notable portion of the report is the negative impact that climate change is having on air pollution, particularly in the Western US, due to wildfires. You can see it in the results: 108 counties in 16 western states had failing grades for daily PM2.5 pollution, compared to just four large counties in three states east of the Mississippi River.
This aligns with a deep modeling study published in December 2023 which showed the longer, more intense wildfire seasons, which are linked to climate change, are reversing the gains made by the Clean Air Act.
There is also a disproportionate impact of air pollution on certain demographic groups and communities of color. Disadvantaged communities often bear the brunt of pollution-related health disparities due to factors such as proximity to industrial facilities, lack of access to healthcare, and socioeconomic barriers. Addressing these disparities requires a multifaceted approach that prioritizes equity, inclusivity, and community engagement in environmental decision-making processes.
How Does Your Area Rank?
You can check the grade for each state or compare your metro area with another for an idea of how your home stacks up.
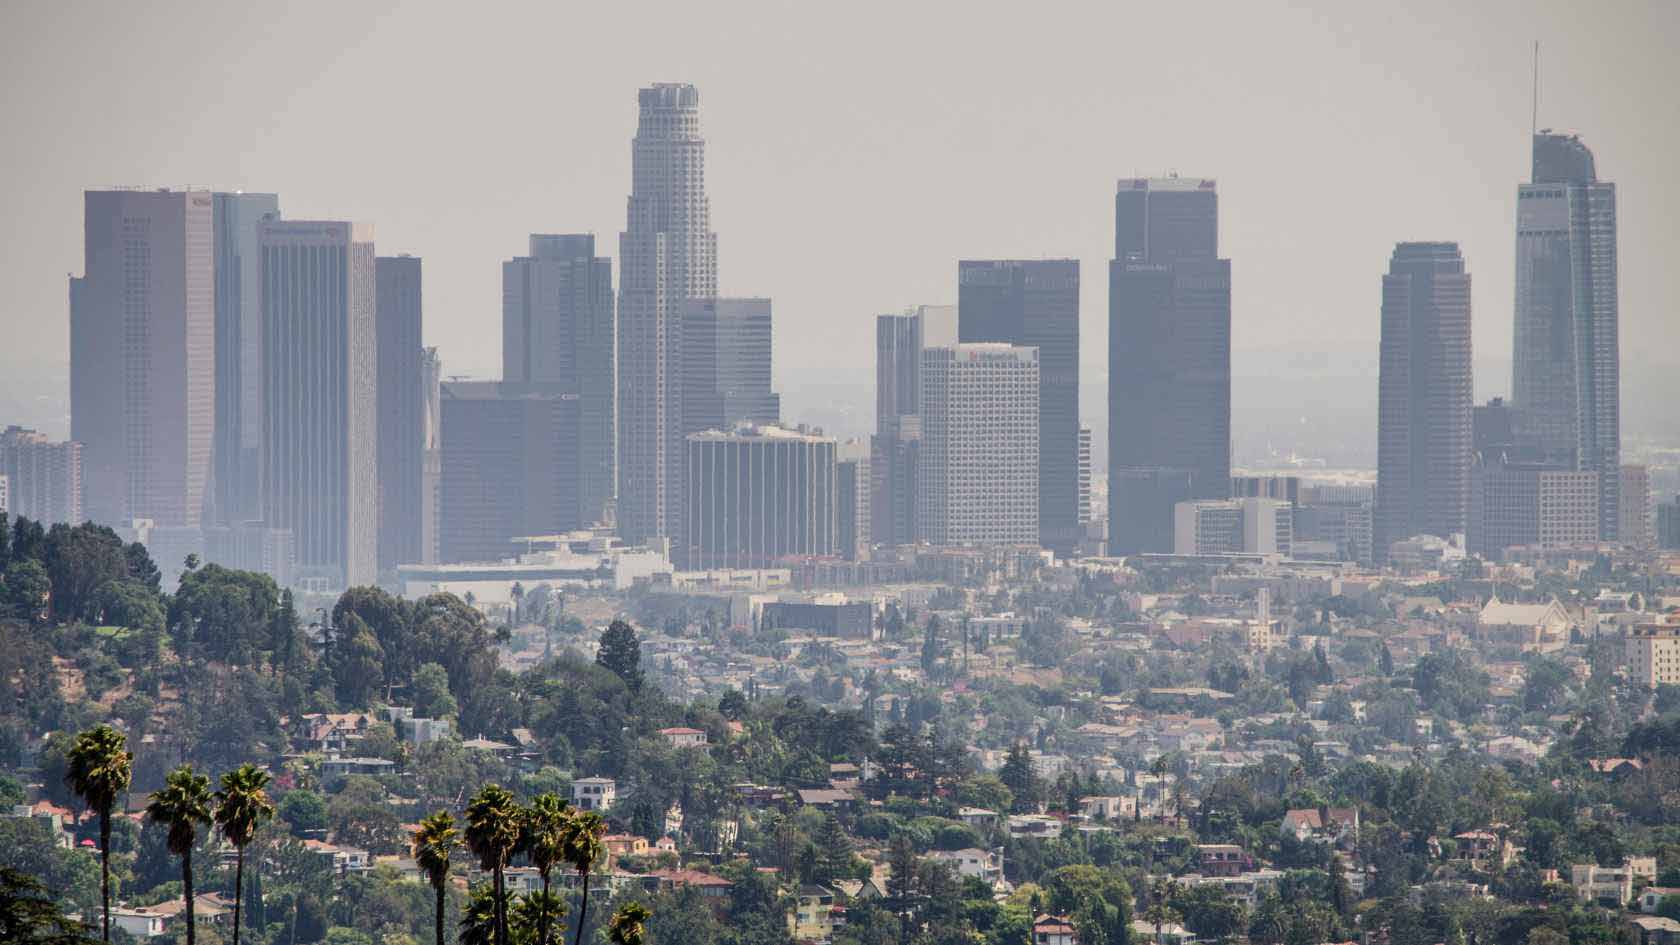
It’s also important to remember that although things aren’t ideal in certain places, improvements have been made. Los Angeles has topped the list for the worst ozone pollution in 24 out of 25 years of “State of the Air” reporting but there were an average of 55 fewer days with unhealthy ozone levels this year than when the report was first published in 2000.
What Individuals Can Do About Air Pollution
The “State of the Air” includes recommendations for federal, state, and local governments to improve air quality. Individuals can also do your part to reduce your exposure to air pollution and protect your family.
- STAY INFORMED: Check the air quality before doing any long-term or highly physical activities outside. You can find this information nowadays in most weather forecasting apps or go online to airnow.gov because even the cleanest areas will experience bad air quality days.
- REDUCE VEHICLE EMISSIONS: Opt for eco-friendly transportation options such as walking, biking, carpooling, or using public transit whenever possible. Choose fuel-efficient vehicles and maintain them regularly to ensure optimal performance and minimal emissions.
- CONSERVE ENERGY: Reduce energy consumption at home and in the workplace by using energy-efficient appliances, turning off lights and electronics when not in use, and implementing energy-saving practices such as proper insulation and thermostat management. (An added bonus: there are tax incentives to switch to electric vehicles and zero-emissions appliances like induction stoves or heat pumps.)
- SHOW UP: You can join the effort by speaking out to your federal, state, and local politicians. You can also join the American Lung Association’s movement to update ozone limits by signing the petition.
- ADD AIR FILTRATION: As previously stated – even the areas with low levels of air pollution experience bad air quality from time to time. Adding air purifiers to your home, like Austin Air cleaners with medical-grade HEPA and activated carbon, will protect you and your family from pollutants, as well as irritants and allergens. If you live near a wildfire zone, you may also want to create a clean room target=”_blank” – it is a place inside the house that can be closed off to smoky outside air with a portable air cleaner target=”_blank”.4
By taking proactive steps to reduce air pollution and promote cleaner air, individuals can contribute to a healthier environment and improve the quality of life for present and future generations. Every small effort counts towards creating a more sustainable and resilient world for all.
The insights gleaned from the 2024 “State of the Air” report serve as a call to action for individuals, communities, and policymakers alike. As stewards of our planet and guardians of public health, we must redouble our efforts to protect and improve air quality, ensuring that everyone has the opportunity to breathe clean, healthy air. In the meantime, this data provides invaluable insight as people decide where to live, what to do, and how to do it.
REFERENCES
1 State of the Air: 2024 Report. (2024 April 24). American Lung Association. https://www.lung.org/getmedia/dabac59e-963b-4e9b-bf0f-73615b07bfd8/State-of-the-Air-2024.pdf.
2 American Lung Association. (n.d.). State of the Air 2024 Methodology. https://www.lung.org/research/sota/about-the-report/methodology.
3 Air Quality System (AQS). (2024, February 7). US EPA. https://www.epa.gov/aqs.
4 U.S. EPA. (2021, December 14). Wildfire Smoke and Indoor Air Quality: How to Create a Clean Room at Home. YouTube. https://www.youtube.com/watch?v=V8DqzogXcVg.